
Visual Insights for Smarter Business Decisions: Vyakhyan’s Time-Based Performance Charts
Posted on June 20, 2026
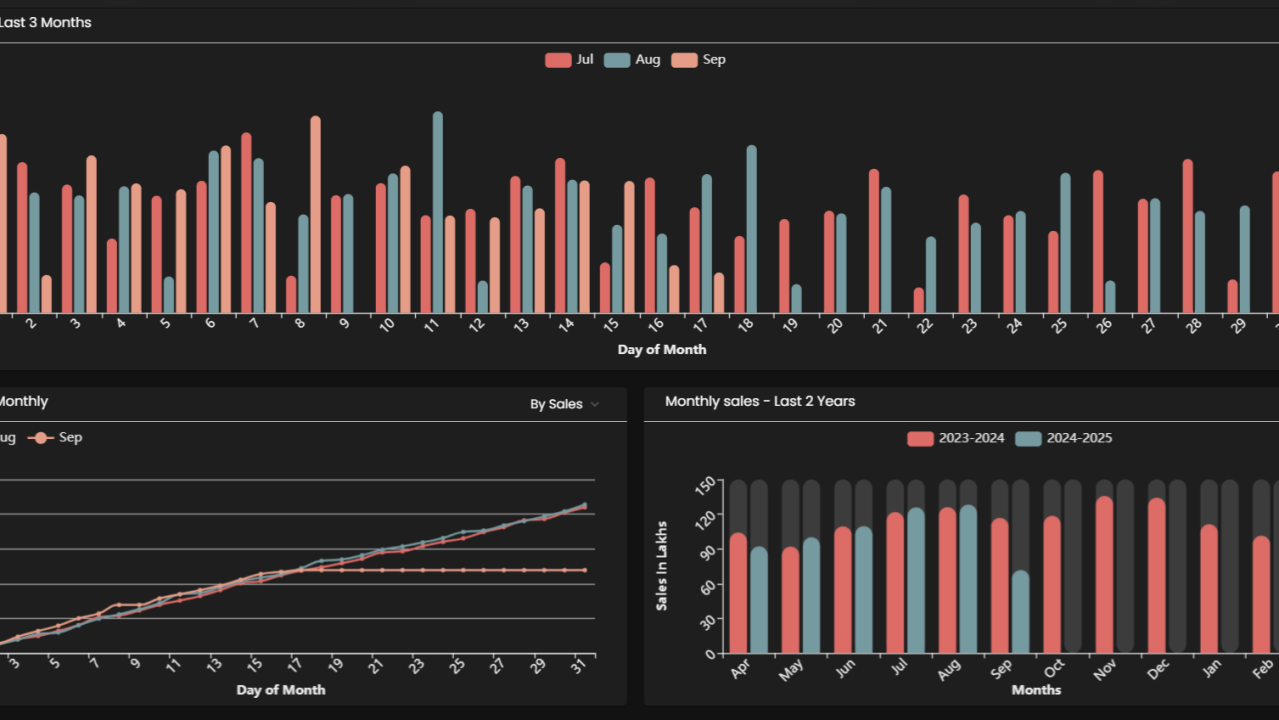
Understanding the Daily Sales View (Last 3 Months) :
This chart offers a bird’s-eye view of daily sales and volume trends for the past three months. Rather than relying on tabular reports or spreadsheets, this visual format makes it easy for users to:
Compare performance across months
Identify dips, spikes, and seasonal patterns
Monitor the immediate effects of promotions, holidays, or supply chain changes
By simplifying day-to-day fluctuations into a visual format, business leaders can respond quickly to changing conditions.
Monitoring Monthly Progress with Cumulative Sales
The cumulative monthly sales chart gives a running total view of sales or volume for each month. This view answers critical business questions such as:
Are we on track to meet our targets this month?
How does our pace compare to previous months?
When during the month, do we typically see performance surges or slowdowns?
This view helps identify growth momentum and supports mid-month interventions where needed.
Two-Year Monthly Comparison: Seeing the Bigger Picture
For long-term planning, Vyakhyan presents a two-year monthly comparison chart. It offers visibility into how each month of the current year is performing relative to the same month in the previous year.
This long-range view is crucial for:
Understanding year-over-year growth or contraction
Highlighting the impact of external changes (e.g., market shifts or regulation)
Strategic planning based on repeatable patterns
Whether your organization uses a financial year or calendar year format, Vyakhyan supports both structures to reflect business-specific reporting requirements.
Contextual Analysis Through Filter Integration
Every chart in the dashboard is responsive to app-level filters. Whether the user wants to analyze data by product category, region, business vertical, or sales channel, the charts update accordingly to reflect:
Specific segments of interest
Regional or departmental performance
Custom time frames for trend analysis
This filter-driven flexibility ensures that leaders view only what matters to their role or objective, reducing noise and driving precision.
A Decision-Making Tool, Not Just a Report
Vyakhyan’s charts are more than static visuals—they are thoughtfully designed decision-making aids. By transforming complex datasets into accessible insights, they allow non-technical users—CEOs, sales heads, operations managers—to:
Track business health in real time
Identify and react to anomalies
Make data-backed strategic choices
With a focus on clarity, relevance, and alignment to business timelines, Vyakhyan helps you move beyond data overload to true operational clarity.
Ready to discover performance insights the visual way?
Vyakhyan helps your team move from reports to real-time intelligence. Explore more, interpret better, and act faster. Contact us to schedule a demo or request more details.