
Dynamic Leaderboard for Performance Comparison
Posted on June 20, 2026
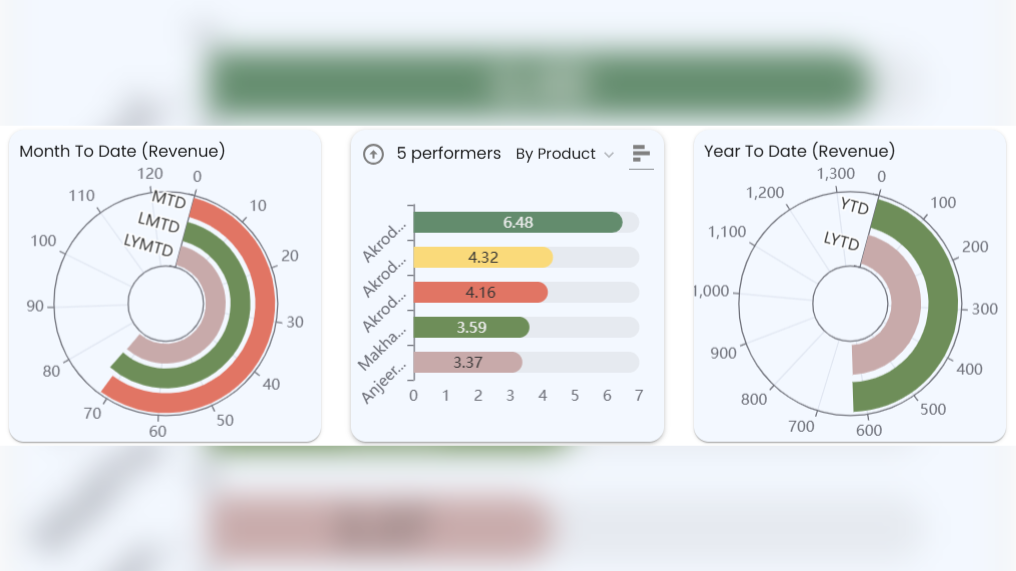
Vyakhyan's leaderboard section is designed to deliver a high-level yet insightful overview of performance across various business metrices. The layout consists of three powerful and interactive visualizations:
1. Radial Bar Charts – Left & Right
- Left Side Chart: This chart offers a comparative view of Month-to-Date (MTD) performance alongside Last Month-to-Date (LMTD) and Last Year MTD (LYMTD). It helps users quickly evaluate whether the current month's performance is on track or lagging behind the previous trends. This real-time snapshot is ideal for course correction during the ongoing month.
- Right Side Chart: This focuses on Year-to-Date (YTD) versus Last Year YTD (LYTD). It provides a long-term view of performance, ensuring businesses stay aligned with their annual goals.
- Both of these charts are fully customizable by metric. Whether it’s revenue, volume, sales count, margin, or any other KPI, the user can track and compare what's most relevant to one’s business.
2. Top Performers & Bottom Performers – Center Chart
The center of the leaderboard is dedicated to showcasing the Top 5 and Bottom 5 performers. The breakdown is determined by a dynamic dropdown filter which allows users to select performance attributes like Branch, Salesperson, Product Category, or any other dimension important to the organization.
- The performance basis—such as Revenue, Volume, Margin, etc.—is also fully configurable, ensuring the leaderboard adapts to multiple business use cases.
- This feature enables fast identification of outperformers for reward or recognition, and underperformers for necessary intervention.
3. Fully Filter-Driven and Customizable
All three visual components of the leaderboard respond in real time to the global filter selections made within the application:
- Users can select any date range to explore historical or forward-looking trends.
- Filters like Branch, Customer Type, Product, or any custom attributes can be applied to refine the leaderboard.
This interactive design ensures that every stakeholder—whether in operations, sales, marketing, or finance—gets personalized and actionable insights without switching views
To learn more or request a demo, contact us at: info@navaantrix.com